The design of a book should complement and enhance its contents.
Below are examples of visual elements in Foundational Papers in Complexity Science.
Click on image to view.
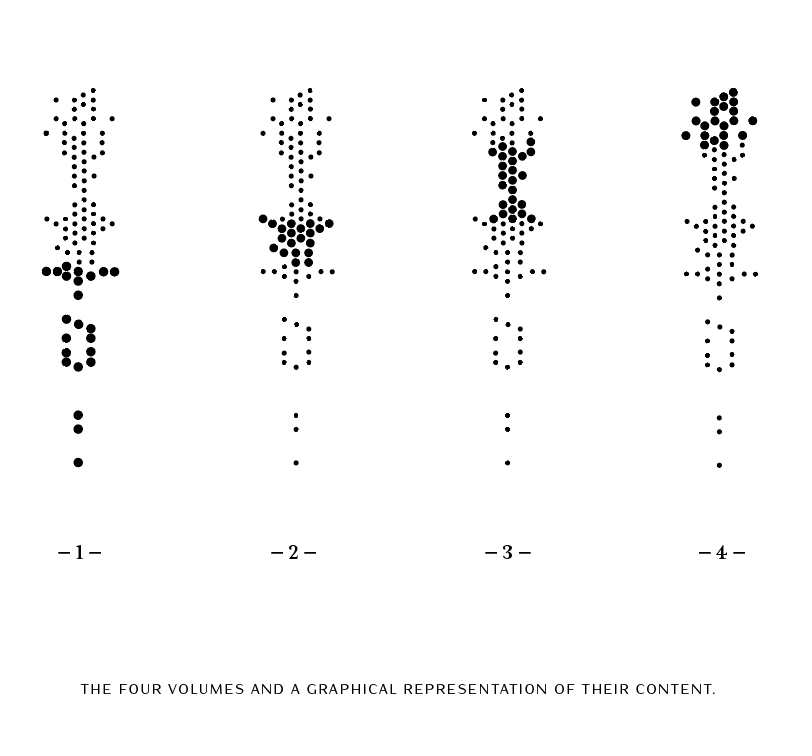
To map the foundational papers in time, all eighty-nine works have been placed on a hexagonal grid. The vertical axis is temporal, with the most recent papers appearing in dot form at the top and the earliest at the bottom.
The spine of each volume indicates its contents: dots representing the included papers are larger than the others.

Click on image to view.
Ideas have impact. This flow chart indicates citations between papers in the collection, highlighting influential work that led to the emergence of complexity science as we currently know it.

Click on image to view.
The Foundational Papers project also maps the lives of the scientists who wrote these papers; each chapter begins with a timeline delineating the author(s)’s birth and death as well the paper’s publication alongside relevant personal, scientific, political, and other events that contextualize the work that follows.